Can I win the Tour de Donut?
Probably not, but I'll give it a shot
The Tour de Donut is happening this weekend. It’s an annual bike race in Staunton, IL1 with a silly twist: there are all-you-can-eat donut stops along the way, and each donut you eat subtracts five minutes from your time. Awesome! Sign me up!
I’m a decent cyclist and I’ve been known to put away a few donuts. Can I put up a competitive time? Could I even win? Let’s analyze past results to find out.
Race overview
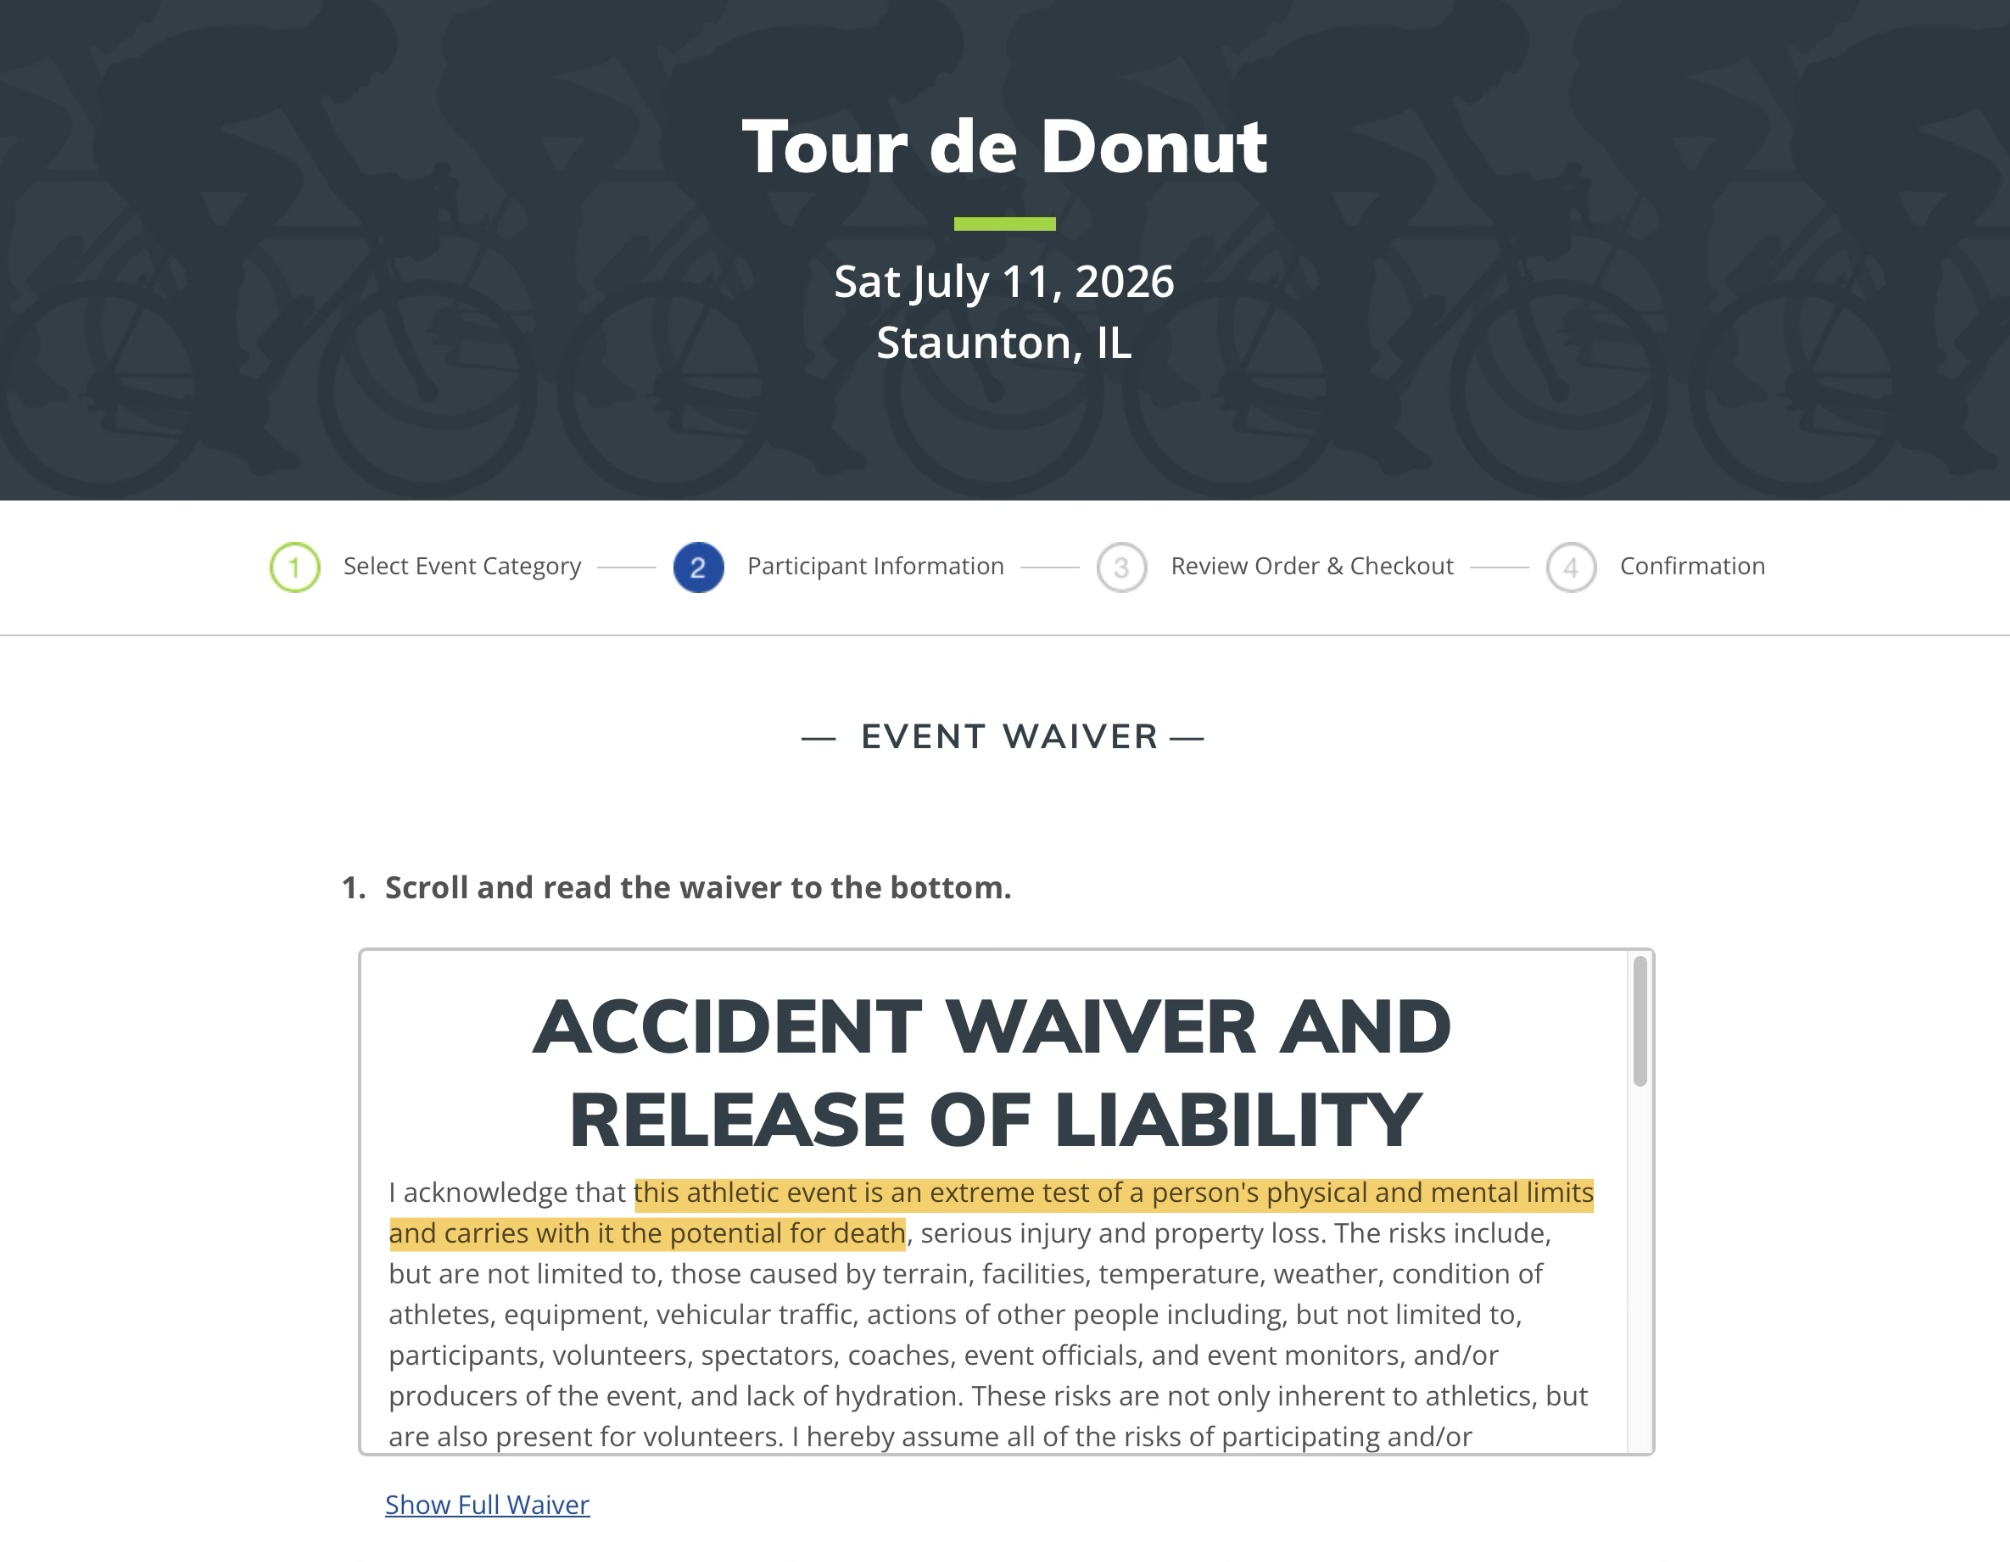
The route for the main race2 is approximately 36 miles and relatively flat (it’s in Illinois, after all). There are two donut stops, at miles 7 and 26. For a decent cyclist, it should be an easy ride—unless you’re slowed down by a bunch of donuts in your stomach.
Typically about 600-700 people sign up for the main race, according to the race website and published results.
Past results and winners
Let’s get a sense for what the winning times look like. The race website has published results going back to 2017. Here are the previous winners:
Tour de Donut winners: 2017-present
| year | name | donuts eaten | donut time (MM:SS) | elapsed MPH | estimated moving MPH |
|---|---|---|---|---|---|
| 2025 | Doug Bristow | 24 | 11:02 | 16.7 | 19.3 |
| 2024 | Yasir Salem | 28 | 09:01 | 14.7 | 17.1 |
| 2023 | Samuel Hancoth | 15 | 50:59 | 17.1 | 18.8 |
| 2022 | Yasir Salem | 24 | 14:44 | 16.0 | 18.5 |
| 2021 | Kyle Hanner | 22 | 6:30 | 18.5 | 21.6 |
| 2020 | n/a | - | - | - | - |
| 2019 | Kyle Hanner | 18 | 45:07 | 15.9 | 17.6 |
| 2018 | Kyle Hanner | 19 | 29:36 | 16.0 | 18.1 |
| 2017 | Benjy Bomkamp | 37 | -13:58 | 12.6 | 15.1 |
Elapsed MPH: course miles divided by elapsed time. Your average speed including time spend eating donuts and not moving.
Estimated moving MPH: It can't be exactly calculated because the results do not include donut eating times. My estimate assumes the top competitors average 45 seconds per donut (plausible, but obviously not exact).
Holy smokes, that’s a lot of donuts. No one’s ever won with less than 15 donuts, and the winner usually eats more than 20.
And some of these guys are real heavy hitters. Yasir and Kyle are both competitive eaters. Yasir has his own webpage dedicated to his Tour de Donut accomplishments (including his personal record of 61 donuts!), and Kyle has a page where he claims 10 career donut race wins.
It’s pretty clear that the Tour de Donut is an eating competition first, bike race second (although some of the winners’ speeds are nothing to scoff at). Zooming out makes that even clearer.
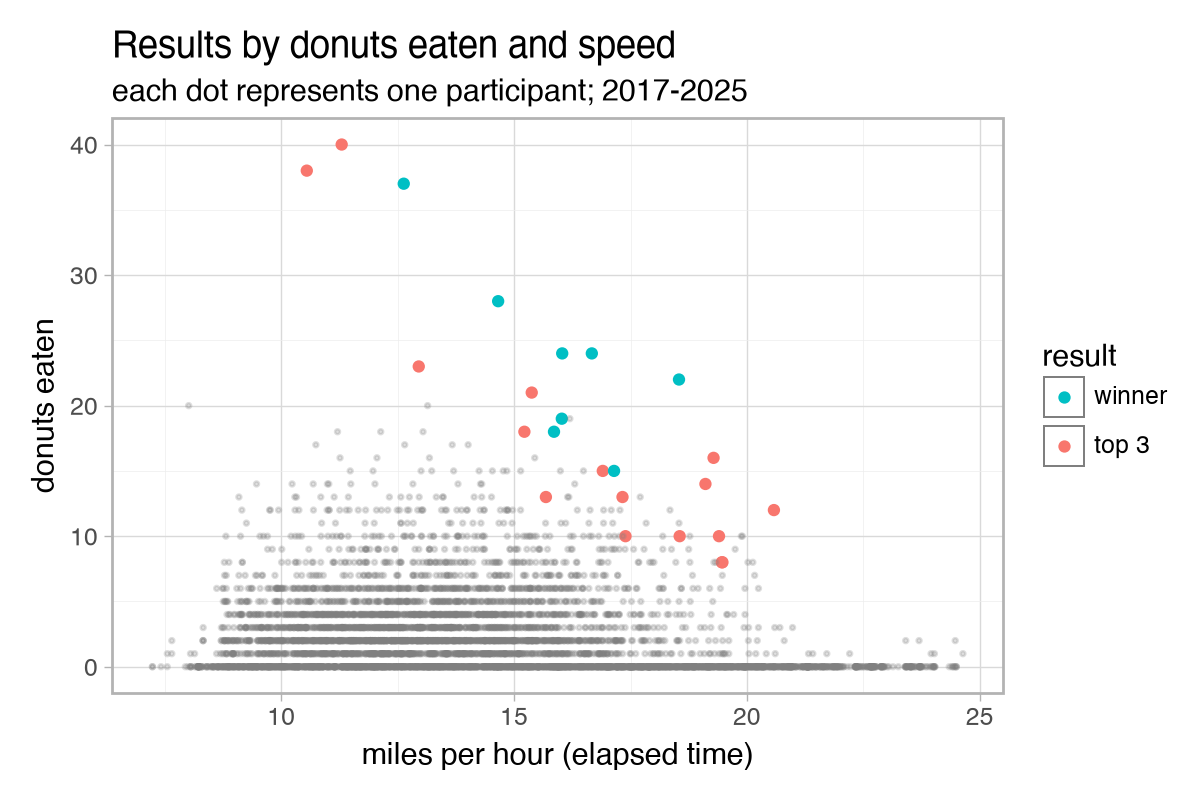
Winners and top-3 finishers tend to eat a lot more donuts than the rest of the field. Speed helps, but it’s not enough on its own. You most likely need to eat at least 20 donuts to win, or at least 10 for a top-3 finish.
My preparation and goals
I haven’t specifically trained for the biking portion of the race, but I ride enough in everyday life (50+ miles per week) that it shouldn’t be an issue. On a flat route like this, I expect to average about 20 MPH while moving. Maybe a bit faster if I’m able to stick with a fast group, or maybe slower if a stomach full of donuts slows me down.
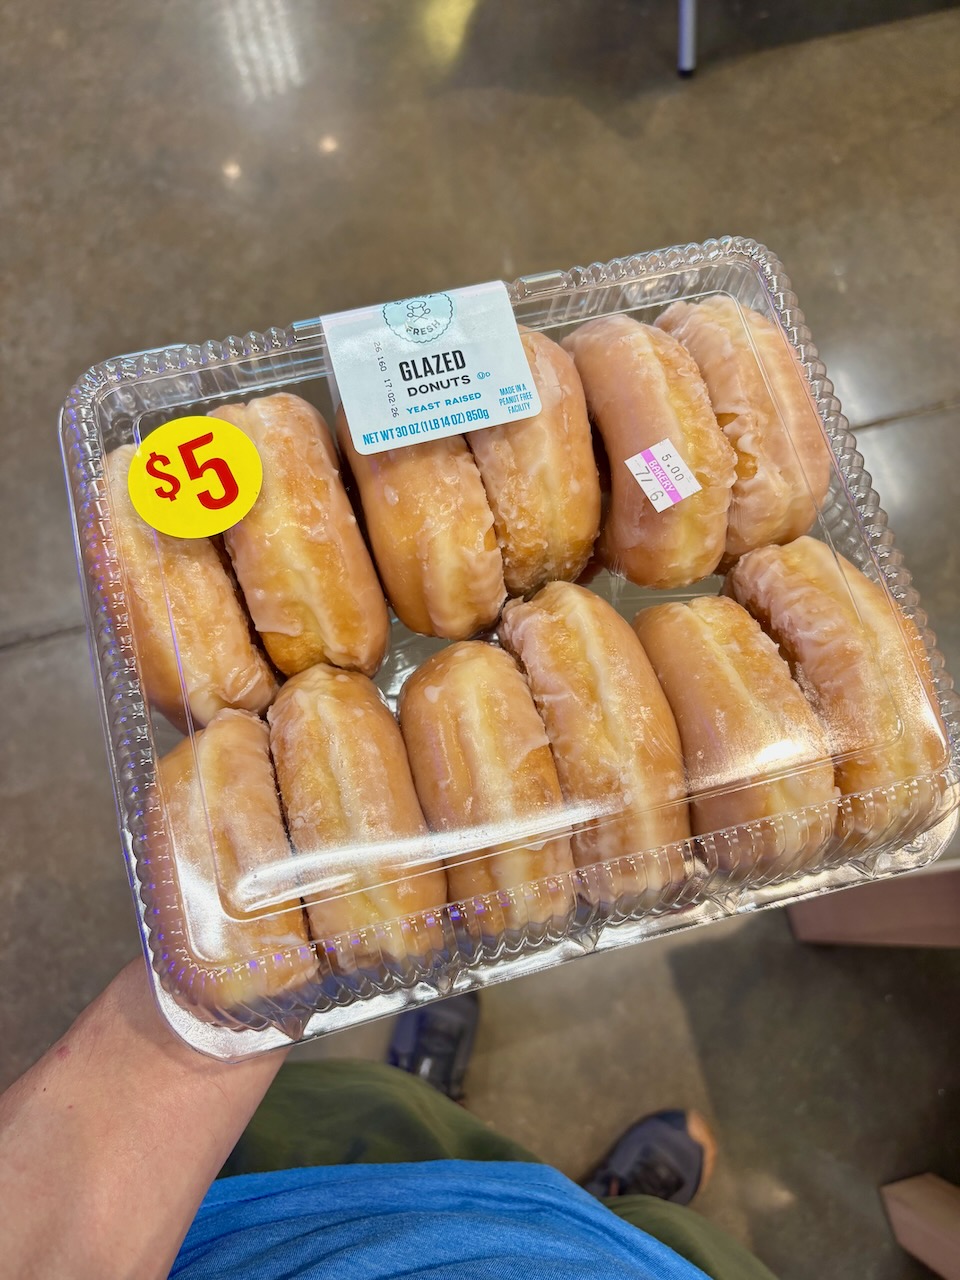
I did a bit of training/benchmarking for the donut portion of the race. I bought a 12-pack of glazed donuts from the grocery store in the middle of a bike ride, ate 6 of them as fast as I could, then continued on the bike ride. The next day I did the same thing with the remaining 6 donuts. I learned three things from that exercise:
- I can “comfortably” eat 6 donuts in one go. I could probably eat a few more, but it would be a slog.
- It takes me about 5 and a half minutes to eat 6 donuts3. That means each donut will net me about 4 minutes off my time (if I can hold that pace, which is not a given).
- Biking with a stomach full of 6 donuts felt surprisingly fine, and I wasn’t any slower.
Given my preparation, here are my realistic (but not easy) and ambitious goals for the race. I’d guess I have a ~50% chance of achieving the realistic goal and a ~5-10% chance of achieving the ambitious goal.
| Realistic Goal | Ambitious Goal | |
|---|---|---|
| Number of donuts | 12 | 16 |
| Moving speed (mph) | 20 | 21 |
| Eating speed (seconds per donut) | 60 | 50 |
| — calculated values — | ||
| –> Elapsed speed (mph) | 18.0 | 18.5 |
| –> Donut time (MM:SS) | 61:12 | 37:20 |
Might I win?
Probably not, but there’s an outside chance. If I achieve one of my goals, here’s how I’d stack up against the field from recent years:
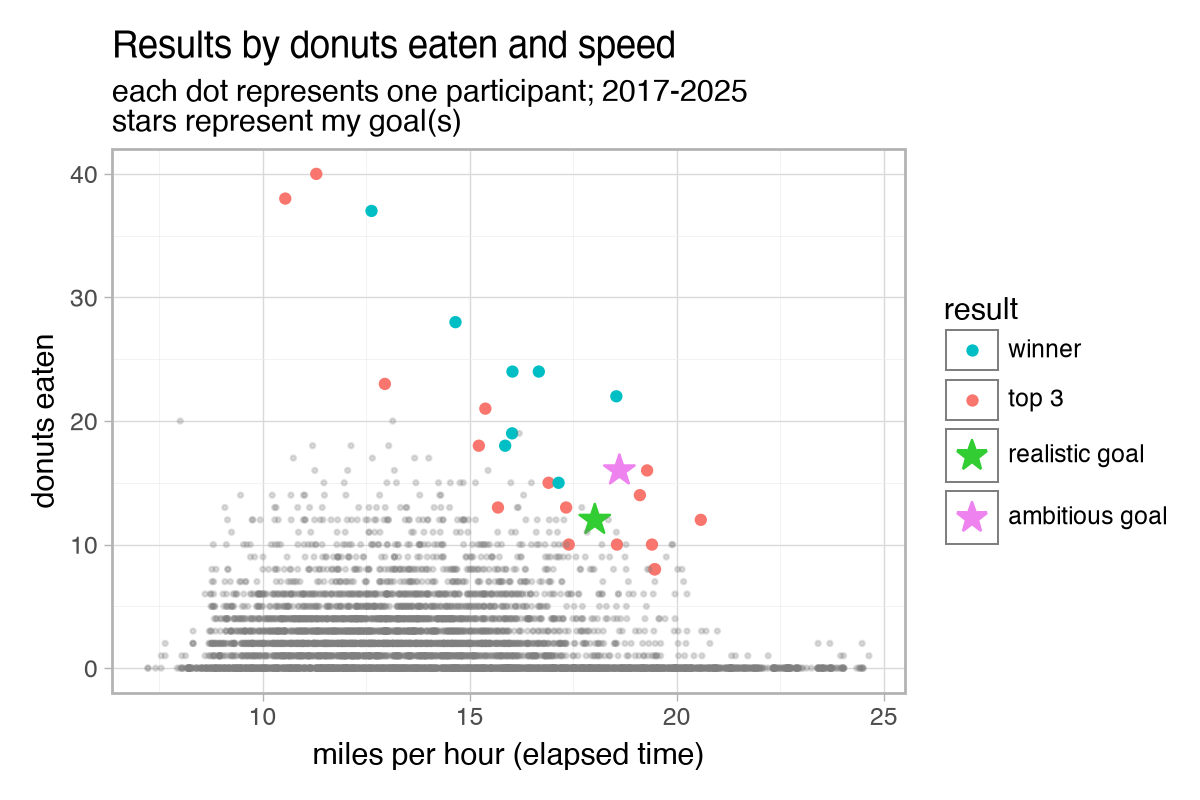
If I achieve my realistic goal, I’m almost certainly not going to win but I might be in contention for a top-3 finish. My donut time would be slower than any of the winners since 2017.
If I achieve my ambitious goal I might have a small chance to eke out a win. My time would be faster than two of the past winners4, but it definitely looks closer to the “Top 3” cluster than the winners cluster on the scatter chart.
Let’s take it one step further and attempt to estimate my win probability. We’ll use a simple logistic regression model. Win probability is basically a function of donuts eaten and elapsed speed, so we can frame a simple model as:
\[ \text{logit}\left(\text{WinProbability}\right)= \beta_0 + \beta_1\text{DonutsEaten} + \beta_2\text{ElapsedSpeed}\]Fitting the model to the data5 and plugging in my goal values gives the following results:
| if I achieve… | Win Probability | Top-3 Probability | Top-10 Probability |
|---|---|---|---|
| Realistic goal | 1.9% | 28.0% | 99.5% |
| Ambitious goal | 16.3% | 97.5% | 100.0% |
And here’s a visual of what it takes to achieve a high win probability, and where my goals would put me:
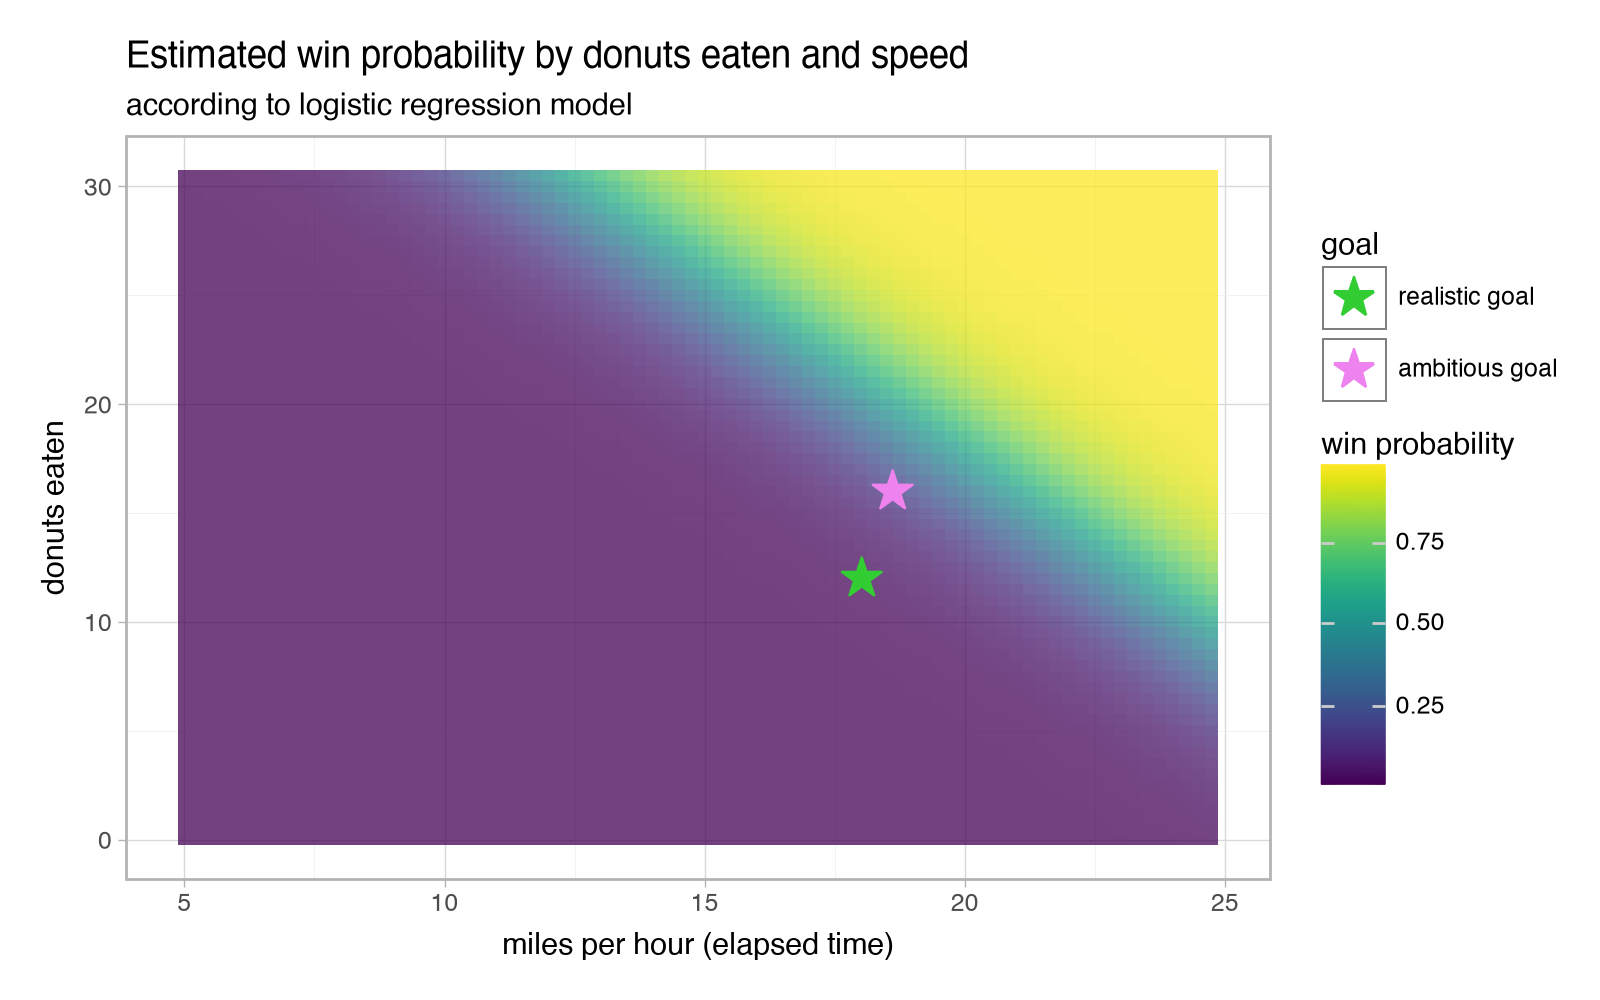
So it looks like I’ve got a pretty low chance of winning, but maybe a solid chance of finishing near the top of the field. Not bad! That’s if I can achieve my goal, of course, which is no sure thing… I’ll follow up next week with my actual results.
Post-race update
I didn’t win.
But I came pretty close! My elapsed time was 2:22:30 and I ate 14 donuts, giving me an adjusted time of 1:12:30. That was good enough for 4th place6!
Full results here. I just missed a top-3 finish—I was just 20 seconds behind 3rd place. The winner beat me pretty good, with a time of 0:43:44. He ate more donuts (16) and had a better elapsed time (2:03:44) than me.
So how’d I do relative to my goals? Here are the details, using my Strava activity for the speed and timing estimates:
Donuts eaten
higher better
14 actual
Goal: 12
Moving speed (mph)
higher better
19.6 actual
Goal: 20
Seconds per donut
lower better
137 actual
Goal: 60
My donut and speed goals were pretty spot on, but I vastly overestimated how quickly I could eat that many donuts. What went wrong? I got really full and hit a wall at the second donut stop. But you don’t have to take my word for it—take a look at my donut eating splits:
| Donut stop | Donuts eaten | Time | Seconds per donut | Net time gained |
|---|---|---|---|---|
| Stop 1 | 10 | 14 minutes | 84 | 36 minutes |
| Stop 2 | 4 | 18 minutes | 270 (4.5 minutes) | 2 minutes |
At the first stop I was reasonably close to my goal of 60 seconds per donut. At the second… not even close.
Was the second donut stop even worth it?
Probably, but just barely.
Since it took me so long to eat those 4 donuts, the stop only netted me 2 minutes off my time. Theoretically, I might have been able to ride the last 10 miles faster with 4 fewer donuts in my stomach. Could I have ridden fast enough to offset those 2 minutes?
I averaged 19.3 miles per hour over the last 10 miles. I would have had to ride 20.6 miles per hour (1.3 mph, or 7%, faster) in order shave 2 minutes off my time. Could I have done it if my stomach were 4 donuts lighter? Maybe, but probably not. In my fastest 10-mile stretch of the whole race (roughly miles 14-24) I averaged 20.2 miles per hour. Donuts or not, I probably didn’t have enough strength or stamina to go even faster than that over the last 10 miles.
What would I do differently next time?
I think there are two viable strategies to win this race:
- Strategy 1: Eat ~75% of your donuts at the first stop and ~25% at the second. Roughly what I did. Good choice if eating is your strength.
- Strategy 2: Ride really fast, skip the first donut stop, and eat as many donuts as you can at the second stop. Good choice if cycling is your strength.
If I did this race again, I’d strongly consider Strategy 2.
But how is that strategy viable? I’d probably eat fewer donuts overall so I’d have to ride considerably faster, and I just admitted that riding 1.3 mph faster probably wasn’t realistic. It comes down to the dynamics of bike racing. Specifically, you can ride much faster in a (fast) group7. If you stop for donuts, the fast groups leave you in the dust.
Here’s how I’d attempt the strategy. I’d try to hang with the lead group of riders for the first 26 miles, or as long as possible. The fastest riders (who did not stop for donuts) averaged 24 mph over the whole route. I hung with them (fairly easily) for for the first 7 miles (until donut stop #1), and I think could reasonably hang on for a good while longer.
If I could achieve each of these things (and none is a given):
- Average 23 mph for the first 26 miles (up from my actual speed of ~20 mph)
- Eat 10 donuts at the second donut stop (same number I actually ate at the first stop)
- Eat those donuts in 14 minutes (same amount of time the first 10 actually took me)
- Average 19.3 mph for the last 10 miles (same as my actual speed)
Then I’d finish with a time of 1:02:54. That’s 10 minutes faster than my actual time, and would have been good enough for second place.
Could I actually hit those numbers? I’m not sure, but this seems like a more plausible path to improving my time than eating more donuts—that just wasn’t going to happen. Maybe I’ll be back next year to give it another shot…8
-
The Staunton, IL race is the original Tour de Donut, according to their website. There are a handful of similar copycat races (the one in Ohio might be the largest). ↩︎
-
There’s also a shorter 12-month route and a tandem division. Combined, there are typically a little over 1,000 participants. ↩︎
-
I used the highly recommended approach of smashing several donuts into a flat, dense patty and eating them together. ↩︎
-
Of course, times aren’t really directly comparable from one year to the next due to different weather and course conditions. ↩︎
-
I didn’t fit the model on the results dataset directly. Instead, I bootstrapped a larger dataset. I repeatedly sampled a simulated field of N=700 records (roughly a typical field size in recent years) from the historical data and computed the winner of that simulated race. I created a dataset of 100 such simulated races, then I fit the logistic regression model on that dataset. This approach gives us a larger and more diverse dataset. ↩︎
-
Out of 472 finishers. (A lower number than usual. The rain likely kept some people away.) ↩︎
-
At high speeds, most (80-90+%) resistance comes from aerodynamic drag. When you ride behind other riders, they block the wind so you can ride faster with the same effort. The effect can be dramatic: up to a ~30-40% drag reduction, yielding 2-5 mph faster speeds. (The actual numbers are highly dependent on factors like hills, wind speed and direction, size of group, size of riders, and so on.) ↩︎
-
Or maybe not… it was pretty unpleasant at times 🤣 ↩︎
Tags: data analysis statistics cycling