Analyzing Vehicle Size and Pedestrian Safety
Are SUVs and trucks more likely to kill pedestrians?
I originally wrote this post on Towards Data Science before moving it here.
The New York Times recently highlighted the “exceptionally American” problem of rising road deaths. Roadways are becoming safer in virtually every developed country across the world, except for the United States. Even during the peak of the COVID-19 pandemic, when there were far fewer cars on the road, traffic deaths continued to increase.
American roadways are particularly dangerous for pedestrians. A March 2022 study from the Insurance Institute for Highway Safety (IIHS) found that pedestrian deaths have increased by 59% since 2009, and 20% of all motor vehicle deaths were pedestrians in 2020. Several factors contribute to these grim statistics, but a big one (pun intended) is the size of vehicles on the road.
Large SUVs and pickup trucks are, unsurprisingly, more likely than smaller cars to injure or kill pedestrians due to their greater weight and taller front ends. And, as you’ve undoubtedly noticed if you live in the US, Americans love big vehicles. Some reports show that now over 80% of new car sales in the US are SUVs or pickups. That’s bad news for pedestrians. And soon we’ll have preposterously heavy EVs to worry about, too.
But can we really take those pedestrian safety statistics at face value? I decided to analyze the data for myself to see if large vehicles are actually causing a significant increase in pedestrian injuries and deaths (spoiler alert: they are).
All code for the analysis below can be found in a Jupyter notebook on GitHub. The notebook contains additional details that are not included in this article.
Dataset
I analyzed data from the city of Chicago, where I live. Chicago publishes traffic crash data (along with lots of other datasets) and makes it publicly available through the Socrata API. It’s easy to start working with Socrata datasets: simply follow the documentation to get an application token, locate the API endpoint(s) you’re interested in, and then start querying. I used the sodapy Python package to interact with the API.
Specifically, I used the three datasets related to Chicago traffic crashes:
- Crashes: Basic details about the crash, such as where and when it occurred. One record per crash.
- People: Details about people involved in the crash. Identifies whether a person was injured and whether they were a driver or pedestrian. At least one record per crash.
- Vehicles: Details about vehicles involved in the crash. Includes make and model and vehicle type. At least one record per crash.
The data in these datasets is collected by the reporting police officer at each crash event.
Methodology
The goal of the analysis is to determine whether large vehicles (SUVs and pickup trucks) are more likely than smaller cars to kill or seriously injure pedestrians. We’ll accomplish this by fitting a logistic regression model, which will show us which factors are relevant in determining whether an injury will occur.
Defining target variable and features
Before fitting a model we need to transform the raw data into a format the model can consume. That means we need to define out target variable (what we are trying to predict) and some features (what we’ll use to make the prediction).
In our case, the target variable is a binary value indicating whether a pedestrian was killed or severely injured the crash (1 = injury, 0 = no injury).
This is easy to calculate from the People dataset.
First we identify whether any of the people in the crash were pedestrians using the person_type field.
Then we determine whether any pedestrian involved had an incapacitating or fatal injury using the injury_classification field.
We’ll actually create two target variables here—one for incapacitating injuries, one for fatal injuries—and model them separately later.
(Note: the dataset defines an incapacitating injury as any injury that “prevents the injured person from walking, driving, or normally continuing the activities they were capable of performing”.)
The main feature we need to include is the vehicle type.
This is mostly straightforward, as the Vehicle dataset includes a classification that distinguishes cars, SUVs, pickup trucks, etc.
However, vehicles are not labeled consistently in the dataset.
For example, one officer might label a Toyota RAV4 as an SUV while another might label it as a car.
In order to account for these discrepancies, we’ll check how each make/model is most frequently labeled and use that for all instances of that make/model.
After that small bit of feature engineering, we can easily calculate two binary features for each crash: one indicating whether an SUV was involved, and one indicating whether a pickup truck was involved.
We should also control for factors other than vehicle that are likely to influence the outcome of a crash, such as weather conditions and the posted speed limit. We’ll do so by including additional features in the regression model, which will allow us to estimate the isolated effect of each individual feature.
Lastly, we’ll remove all crashes that did not include pedestrians from the dataset because those crashes are not relevant to the question at hand.
Logistic regression model
The question we’re trying to answer is easily framed as a binary classification problem. Given some information about a crash, predict whether a pedestrian will be killed (or injured). In our use case, it’s also crucial to understand why that prediction is being made.
Logistic regression is a good choice because it produces a simple and interpretable model. We’ll be able to analyze the model to understand which features contribute positively or negatively to the probability of the target variable. Specifically, we’ll be able to see whether vehicle type has a significant effect on pedestrian deaths and injuries.
The full math behind logistic regression is beyond the scope of this article, but essentially the model will produce a linear predictor:
$$ \beta_0 + \beta_{is\_suv}X_{is\_suv} + \beta_{is\_pickup}X_{is\_pickup} + \beta_{speed\_limit}X_{speed\_limit} + \dots $$where the \(\beta\) coefficients represent the effect of each feature \(X\) on the target variable. We can convert the coefficients into odds ratios that are easily interpretable (e.g., the likelihood of a pedestrian injury is \(Z\%\) higher when the vehicle is an SUV).
We’ll fit two separate logistic regression models: one to predict pedestrian deaths, and another to predict pedestrian incapacitating injuries (including deaths). Other than the target variables, the model structure is identical.
Assumptions
We’re making several assumptions in the model, either explicitly or implicitly:
- SUVs and smaller cars are involved crashes involving pedestrians at an equal rate. We’re only predicting the outcome of a crash, not whether the crash would have occurred at all with a different car. (Note: there is some evidence that SUVs hit pedestrians at a higher rate than small cars, which would dispute this assumption. If that is indeed true, the impact of SUVs on pedestrian deaths may be worse than results below indicate.)
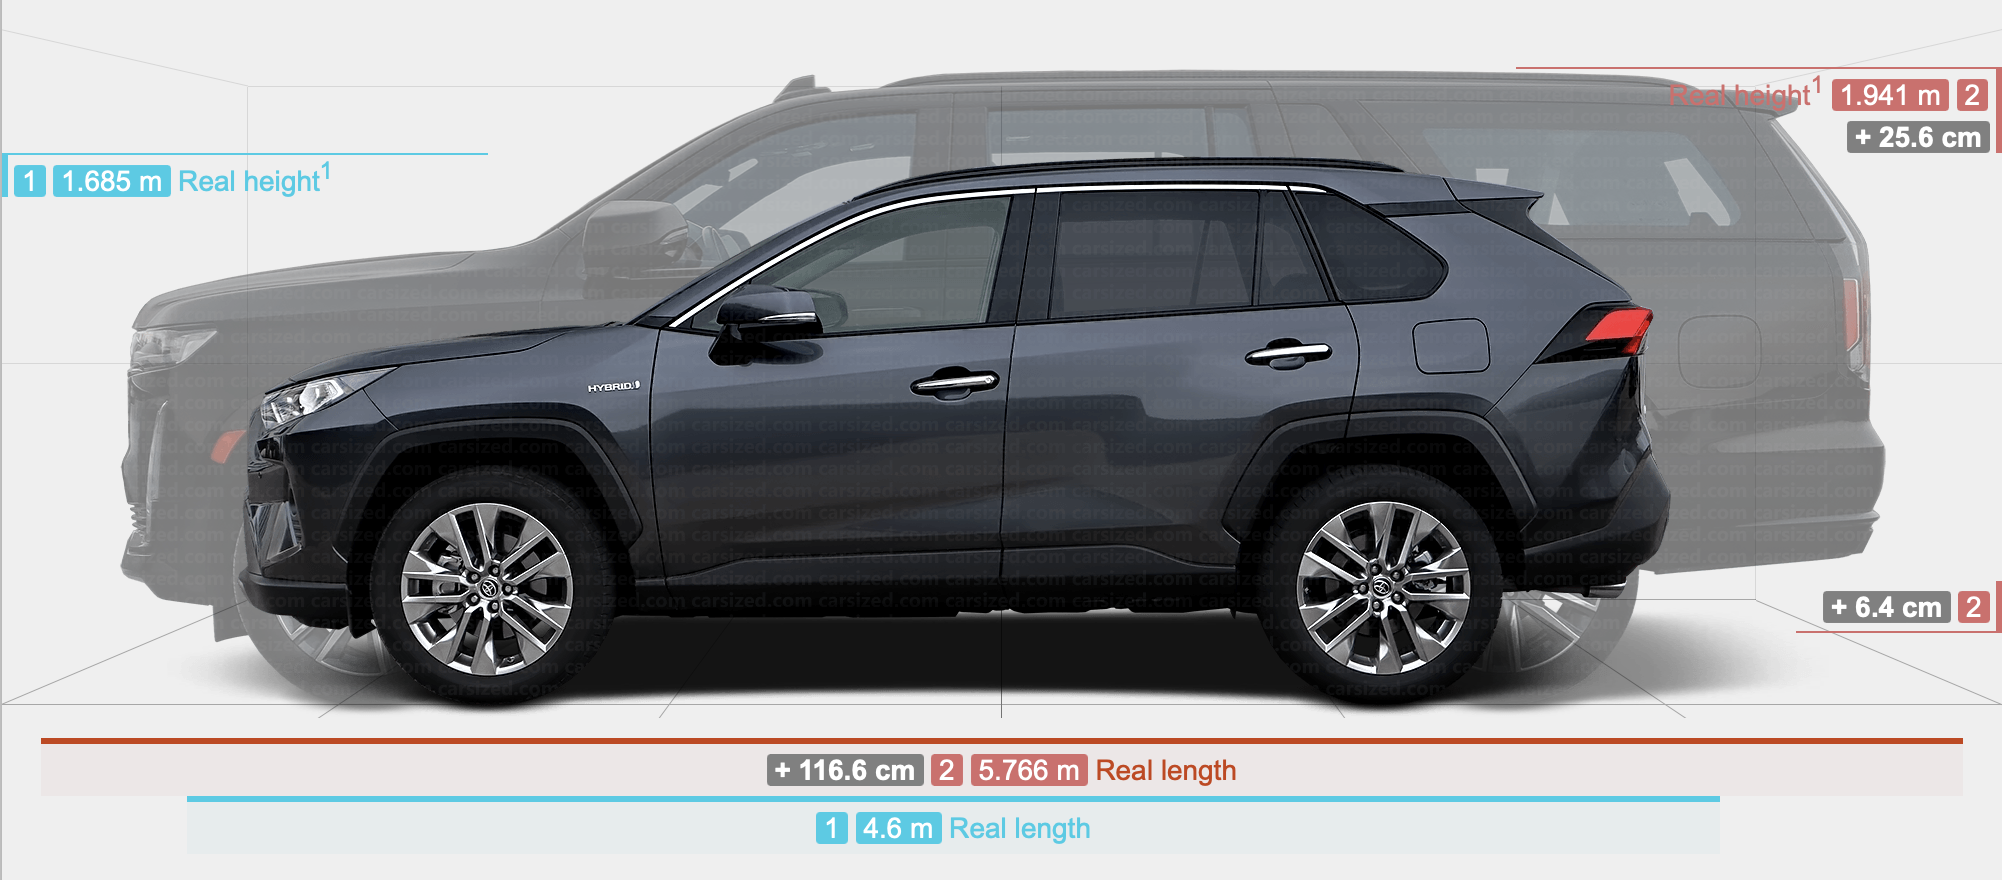
- All SUVs are the same (and all pickup trucks are the same). Obviously this is not the case in the real world, as SUVs come in vastly different shapes and sizes.

Obviously these two SUVs are not the same, but they are treated as such in the model. Image from carsized.com.
Results
So are SUVs and pickup trucks more dangerous to pedestrians? Yes.
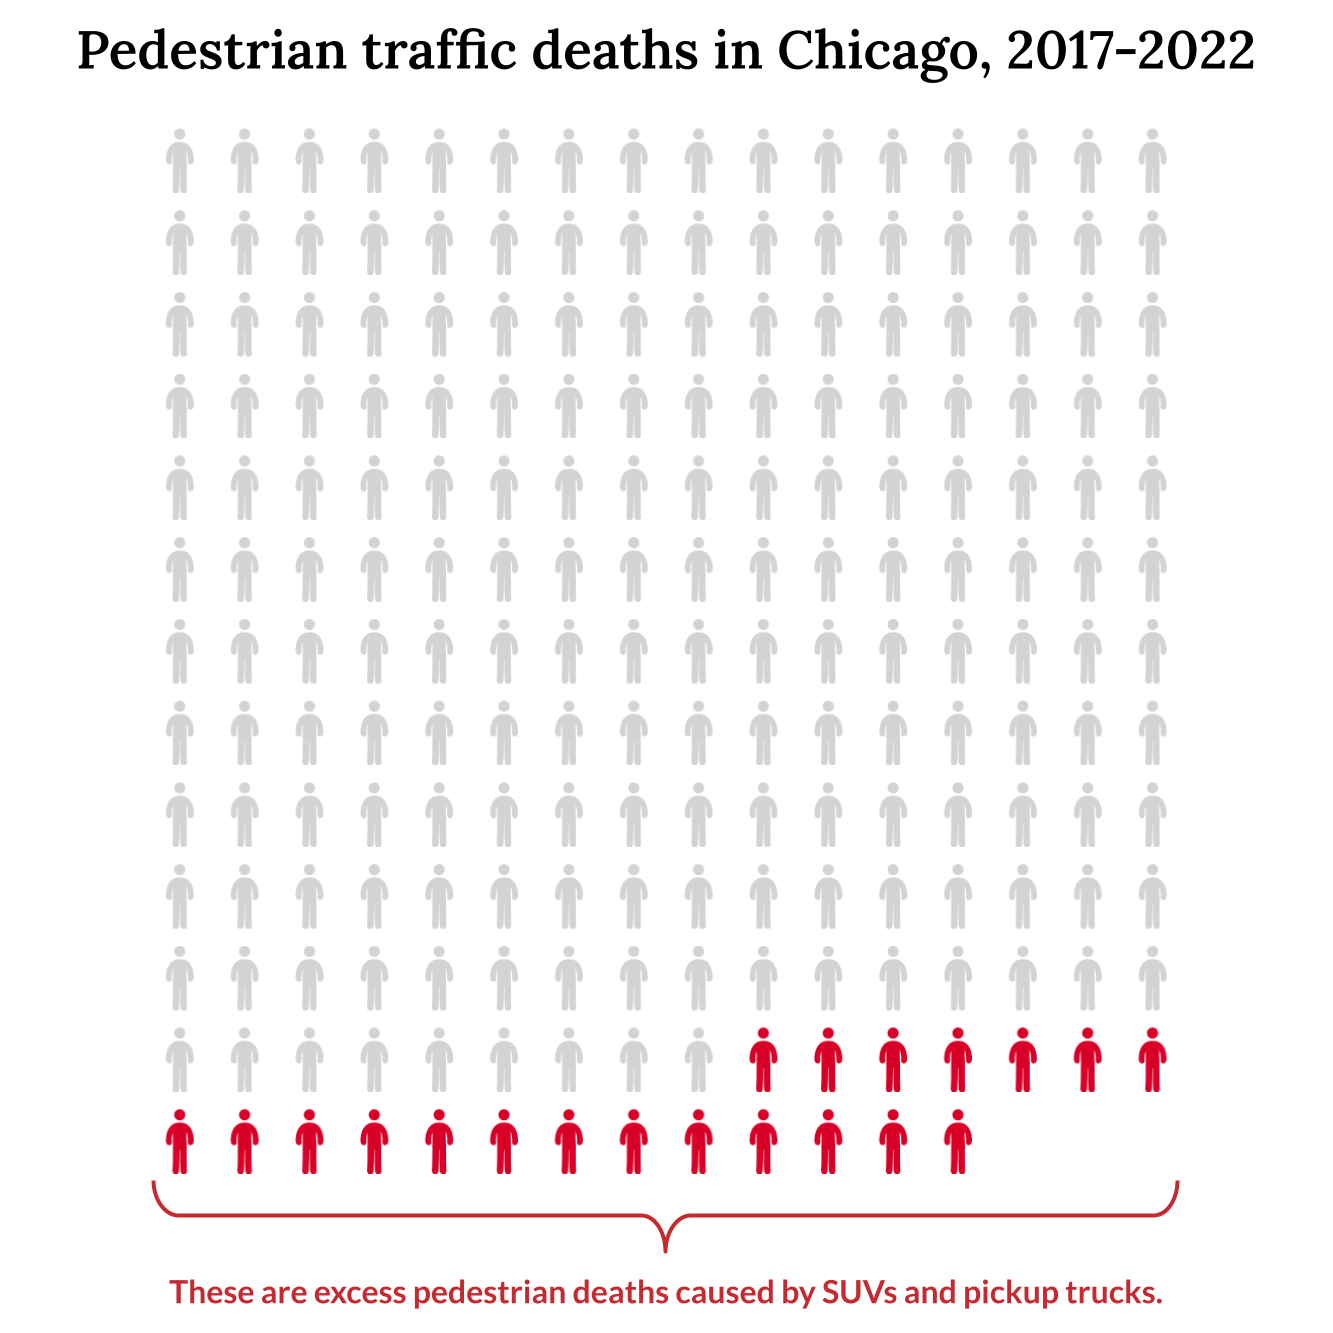
The logistic regression models show that SUVs are 16% more likely to cause incapacitating injuries and 36% more likely to kill pedestrians than smaller cars. Pickup trucks are 33% more likely to cause incapacitating injury and 108% (more than twice as likely!) to kill pedestrians. The model predicts that there were about 20 excess deaths over the last five years in Chicago due to SUVs and pickup trucks. In other words, if those vehicles were replaced by smaller cars those deaths would not have occurred.

205 pedestrians were killed by personal vehicles between 2017 and 2022. Approximately 20 lives would have been saved if SUVs and pickup trucks were replaced with smaller cars.
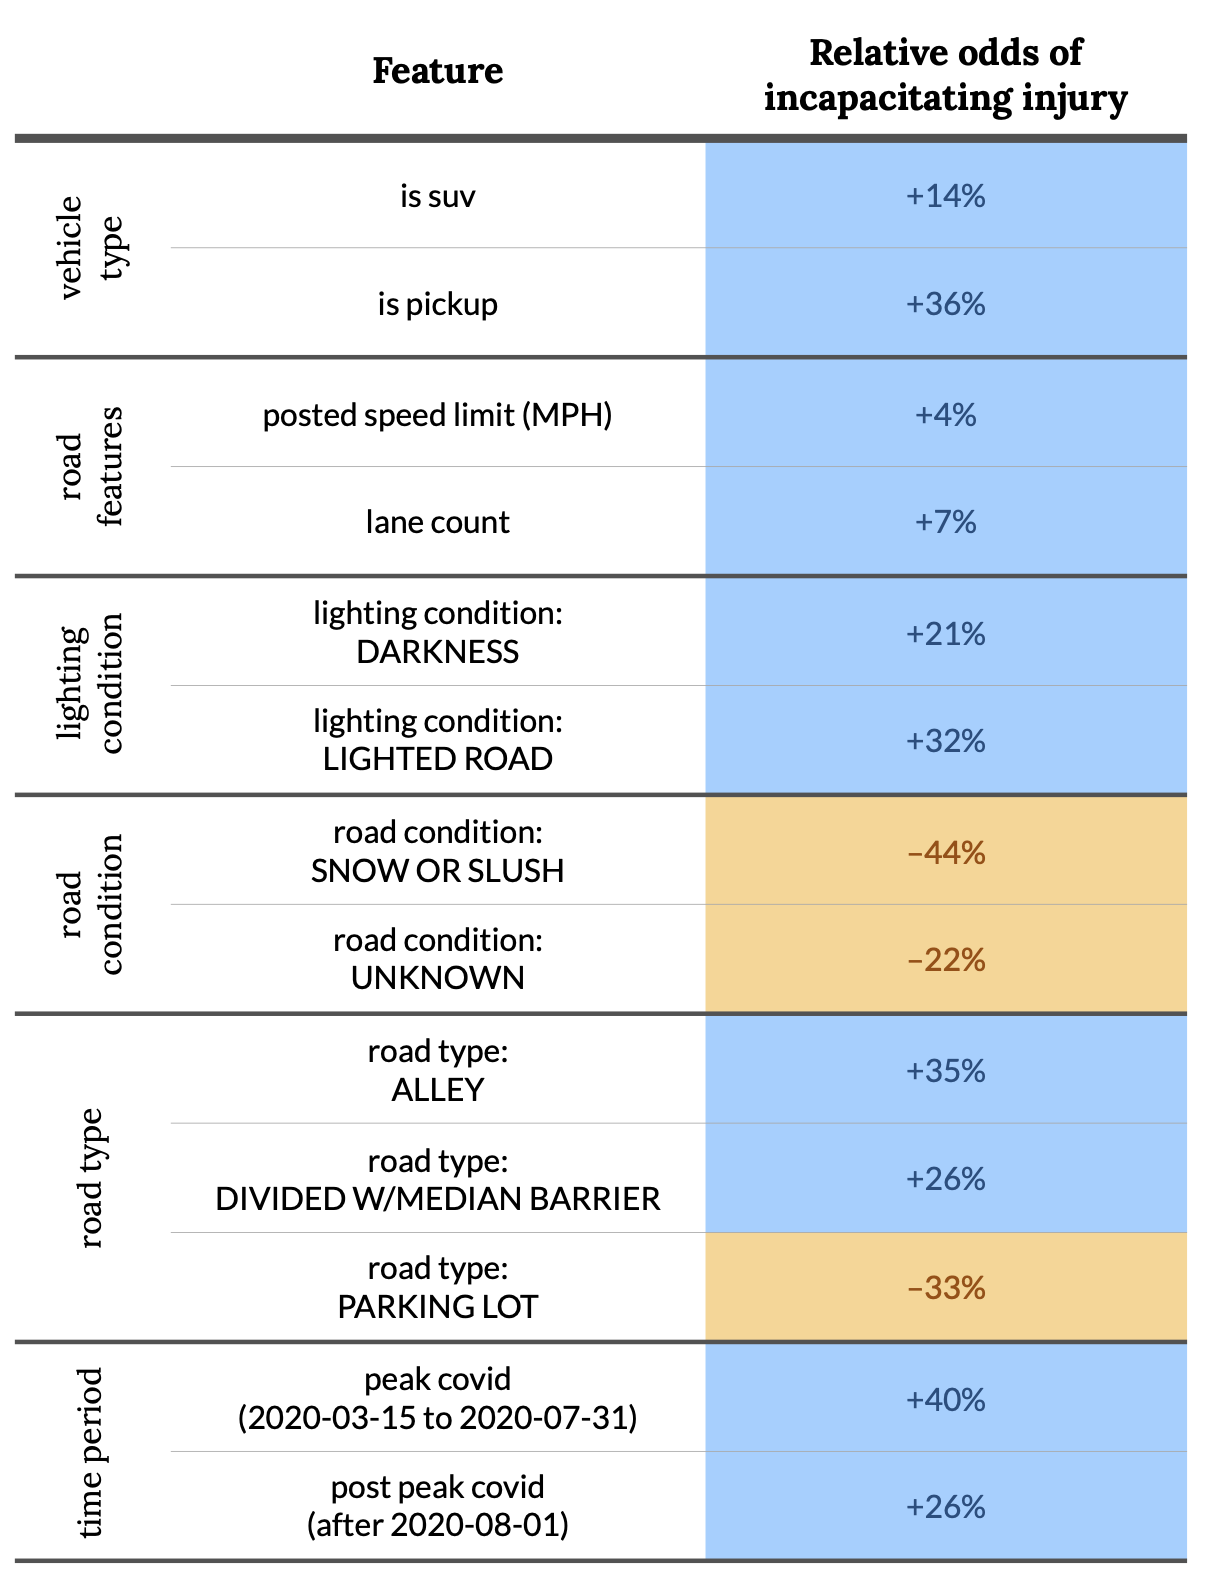
The model also identifies some other interesting (but maybe not wholly surprising) factors that contribute to pedestrian fatalities. The table below shows the impact of all features that the model found to be statistically significant. Here is a summary of the key findings:
- Large vehicles are more dangerous to pedestrians. SUVs and pickup trucks are statistically more likely to cause incapacitating injuries. A fairly obvious result and the main topic of this article.
- High speeds are dangerous to pedestrians. And, perhaps more importantly, conditions that allow for high speeds are dangerous to pedestrians. This is most obviously shown by the positive relationship with speed limit, but is also shown by other features (roads with more lanes or separated by a median often allow for higher speeds; parking lots do not). Perhaps surprisingly, snowy conditions decrease the likelihood of pedestrian injuries. This could be because cars are forced to drive slower on snowy roads.
- Low visibility conditions are dangerous to pedestrians. Likelihood of injury increased at night. Crashes in alleys were also likely to cause injury, perhaps because drivers have decreased visibility in narrow alleys (and alleys are likely to have pedestrians and vehicles passing through the same space).
- Severe pedestrian injuries became more common during COVID. There was a statistically significant change in behavior during the COVID-19 pandemic even when controlling for other features in the dataset. Two binary date features (“peak COVID” and “post peak COVID”) were added to the model to account for this difference. This might be attributable to emptier streets allowing for higher speeds during the height of the pandemic. (Note: the gross number of incapacitating injuries did not necessarily increase; the model is detecting an increase in the rate of incapacitating injuries during COVID.)
The following table shows the data points supporting the summarized information above, and additional details (such as confidence intervals) can be found on GitHub.

A table summarizing the impact of various features of a crash on the likelihood of an incapacitating injury to a pedestrian. Features are only included if the model identified them as statistically significant (p < 0.05). “Relative odds” of +X% means that the likelihood of an incapacitating injury are X% higher if the given feature is true (or with a one unit increase for numerical features) and all other features of the crash are held constant.
Conclusions… and what can we do about it?
We reached the conclusion that—drumroll, please!—bigger, heavier cars are more likely to kill pedestrians than smaller, lighter cars. Ok… not exactly groundbreaking. However, a lot of people don’t realize it’s a problem in our cities—I never thought about it until it was pointed out to me. I’m hopeful that some hard evidence will spread awareness of the problem.
So what can we do?
Firstly, you’re not a bad person if you drive an SUV or pickup truck. I’m not even going to try to talk you out of buying one. There are plenty of reasons people buy those vehicles (and some of those reasons might even be valid).
Notably, SUVs do appear to make the driver safer in a crash. That presents a situation in which each individual driver is incentivized to buy a large vehicle, but if every driver makes that decision the system becomes more dangerous for everyone (especially people outside cars). The only clear winner in that “safety arms race” scenario is the car company wants to sell you an expensive SUV rather than a cheaper sedan.
At the risk of getting a little political, one way to address the problem would be through regulation. For example, European vehicle safety regulations include provisions for pedestrian safety; American safety regulations do not. Just something to keep in mind the next time you’re on your way to vote (especially in local elections, where elected officials can actually influence your city’s streets).
Tags: data analysis